The Office of Data and Innovation (ODI) built a tool that helps the Department of Water Resources (DWR) create trustworthy environmental monitoring data.
Project scope
- Timeline: 5 months
- Team: 1 data scientist, 1 user researcher, 2 program managers, 1 analytics manager, 5 environmental scientists
- Reach: 27 million people and 750,000 farmland acres
Partner
Methods
- Data engineering
- Data visualization
- Machine learning
- Statistical methods
- Usability testing
- User research
The opportunity
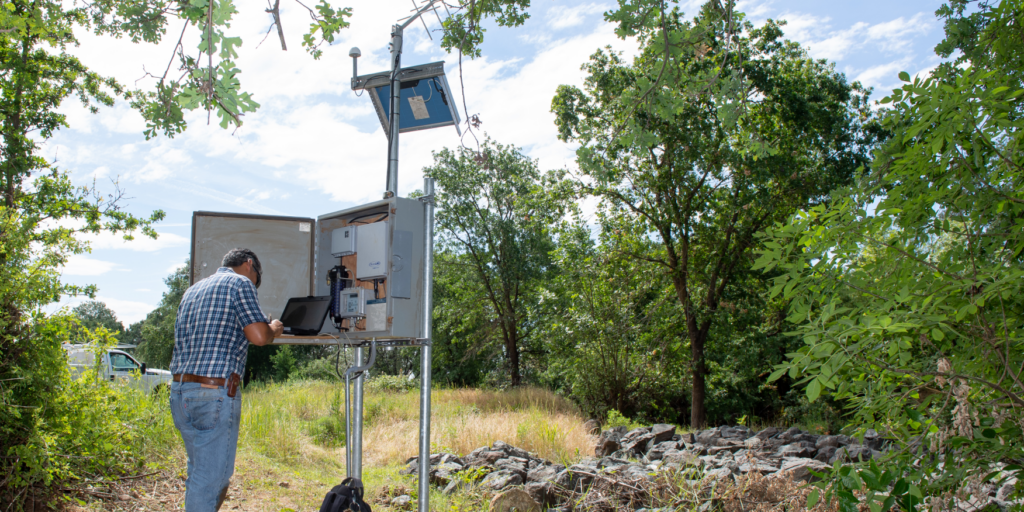
DWR collects environmental monitoring data from instruments in water bodies throughout the state. Sometimes, these instruments produce errors or missing values. Anyone with an at-home rain gauge knows how this can happen. An animal could break it, it could leak, or something other than rain might fall into the gauge. Sophisticated environmental sensors can suffer from similar problems.
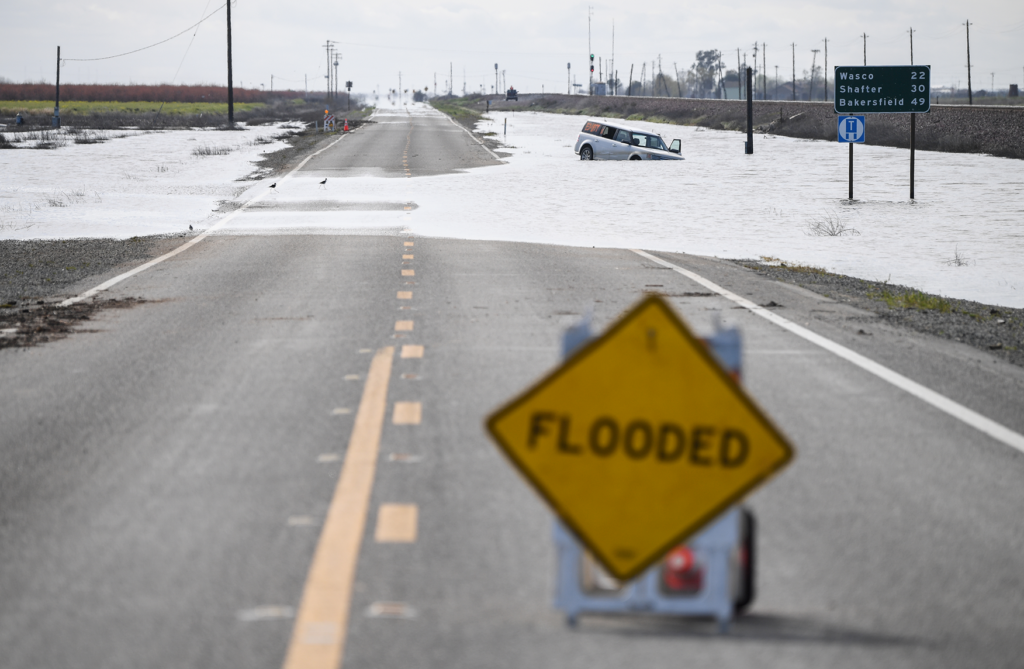
Water contractors, flood-fighters, and the public use these data to make critical decisions. Water contractors may ask, “Should we take extra steps to clean our water?” Flood-fighters may ask, “Should we shut down this road?”
They need trustworthy, reliable, consistent, and error-free data to make good decisions. And they need it quickly.
How we helped
We built a tool that assesses the quality of environmental monitoring data.
- The tool is open source and anyone can use it.
- The tool quickly and efficiently identifies errors in the data. This saves hundreds of hours of staff time.
- Staff can easily and quickly make environmental monitoring data publicly available.
Our approach
We designed many advanced statistical tests to check for errors in the data.
- We worked with a group within DWR called the Outlier Detection Group. They recommend methods to check for outliers, or unusual values, in the data.
- We did 2 rounds of user research with scientists to assess their needs. Through our usability testing, we made 28 recommendations for changes to the tool.
What we built
ODI built a tool that implements these tests. It rapidly outputs trustworthy, reliable, consistent, and error-free environmental monitoring data. We made sure our tool was easy to use.
- The tool works for over 100 different types of environmental monitoring data. Examples include snow depth, water temperature, and wind speed.
- The tool automatically outputs data in a standardized format.
DWR staff can upload these data onto various open source data repositories. One example is the California Data Exchange Center. Over 2 million people query the California Data Exchange Center during flood season.
What’s next
DWR plans to build on this project by:
- Creating standardized review methods, data formats, and data repositories
- Socializing these policies with DWR staff so they feel empowered to innovate
- Incorporating machine learning methods to detect errors in environmental data
This tool improves the quality of DWR’s environmental data. It helps DWR meet its mission to reliably provide water to the people of California while protecting the natural environment.
—Theodore J. Swift, Senior Environmental Scientist, DWR
Data Science Accelerator
The Data Science Accelerator (DSA) helps departments tackle business challenges using data science. The DSA works closely with teams to apply analytics, unlock new insights, and find new ways to effectively use available data. DSA projects use advanced analytics to directly improve a service or process. DSA projects emphasize:
- Smarter and more efficient work
- More effective use of staff time and resources
- Data-driven decision making
Learn more about ODI’s work on this project in our technical paper.