ODI used human-centered design to make it easier for crime victims to get funds for recovery.
Project scope
- Timeline: 6 weeks
- Team: 4 user researchers, 1 PM, 1 UX designer, 1 content designer, 1 data analyst
- Reach: 42 Californians including victims and families, victim advocates, claims processors, community-based organizations, law enforcement, mental health providers, and CalVCB staff
Partners
Methods
- Content design
- Data analytics
- Desk research
- Journey mapping
- Usability testing
- User experience research
- User interviews
Needs
The California Victim Compensation Board (CalVCB) approached the Office of Data and Innovation (ODI) in 2022 with a challenge. Violent crimes had gone up in California over time, but applications for victim’s compensation had gone down. It’s CalVCB’s mission to compensate victims of these crimes to aid in their recovery. CalVCB wanted to understand why fewer eligible people were applying to their fund, find out how to reach them, and increase applications.
CalVCB received 39,015 applications and paid $40.3 million in compensation (2021-2022)
173,864 violent crimes committed in California in 2020
Approach
Over 6 weeks, we worked with CalVCB to hear from eligible victims and identify strategies to improve the experience of applying for assistance. Central to ODI’s work was engaging directly with victims and those that support them in order to strengthen the connection between CalVCB and the Californians they serve.
Stakeholder interviews
We met with CalVCB leadership and staff to understand how they support victims through the application, evaluation, and reimbursement process.
Usability testing
We walked through the application process to identify ways to give clear, visual guidance to applicants throughout the process. We assessed the accessibility of the website with victims and advocates and identified places where applicants get frustrated or stuck.
User research
We engaged over 40 Californians in our research, meeting them at police stations, community-based organizations, Trauma Recovery Centers, and even donut shops to hear their perspectives on how to connect victims to benefits.
Data analysis
We collaborated with the Possibility Lab at UC Berkeley on data analysis, which showed a large gap between applications to CalVCB and eligible victims.
Tools
To understand victims’ needs and see how they experience the CalVCB application process, we created a number of resources. All highlight the roles and experiences of victims and those connected to their recovery.
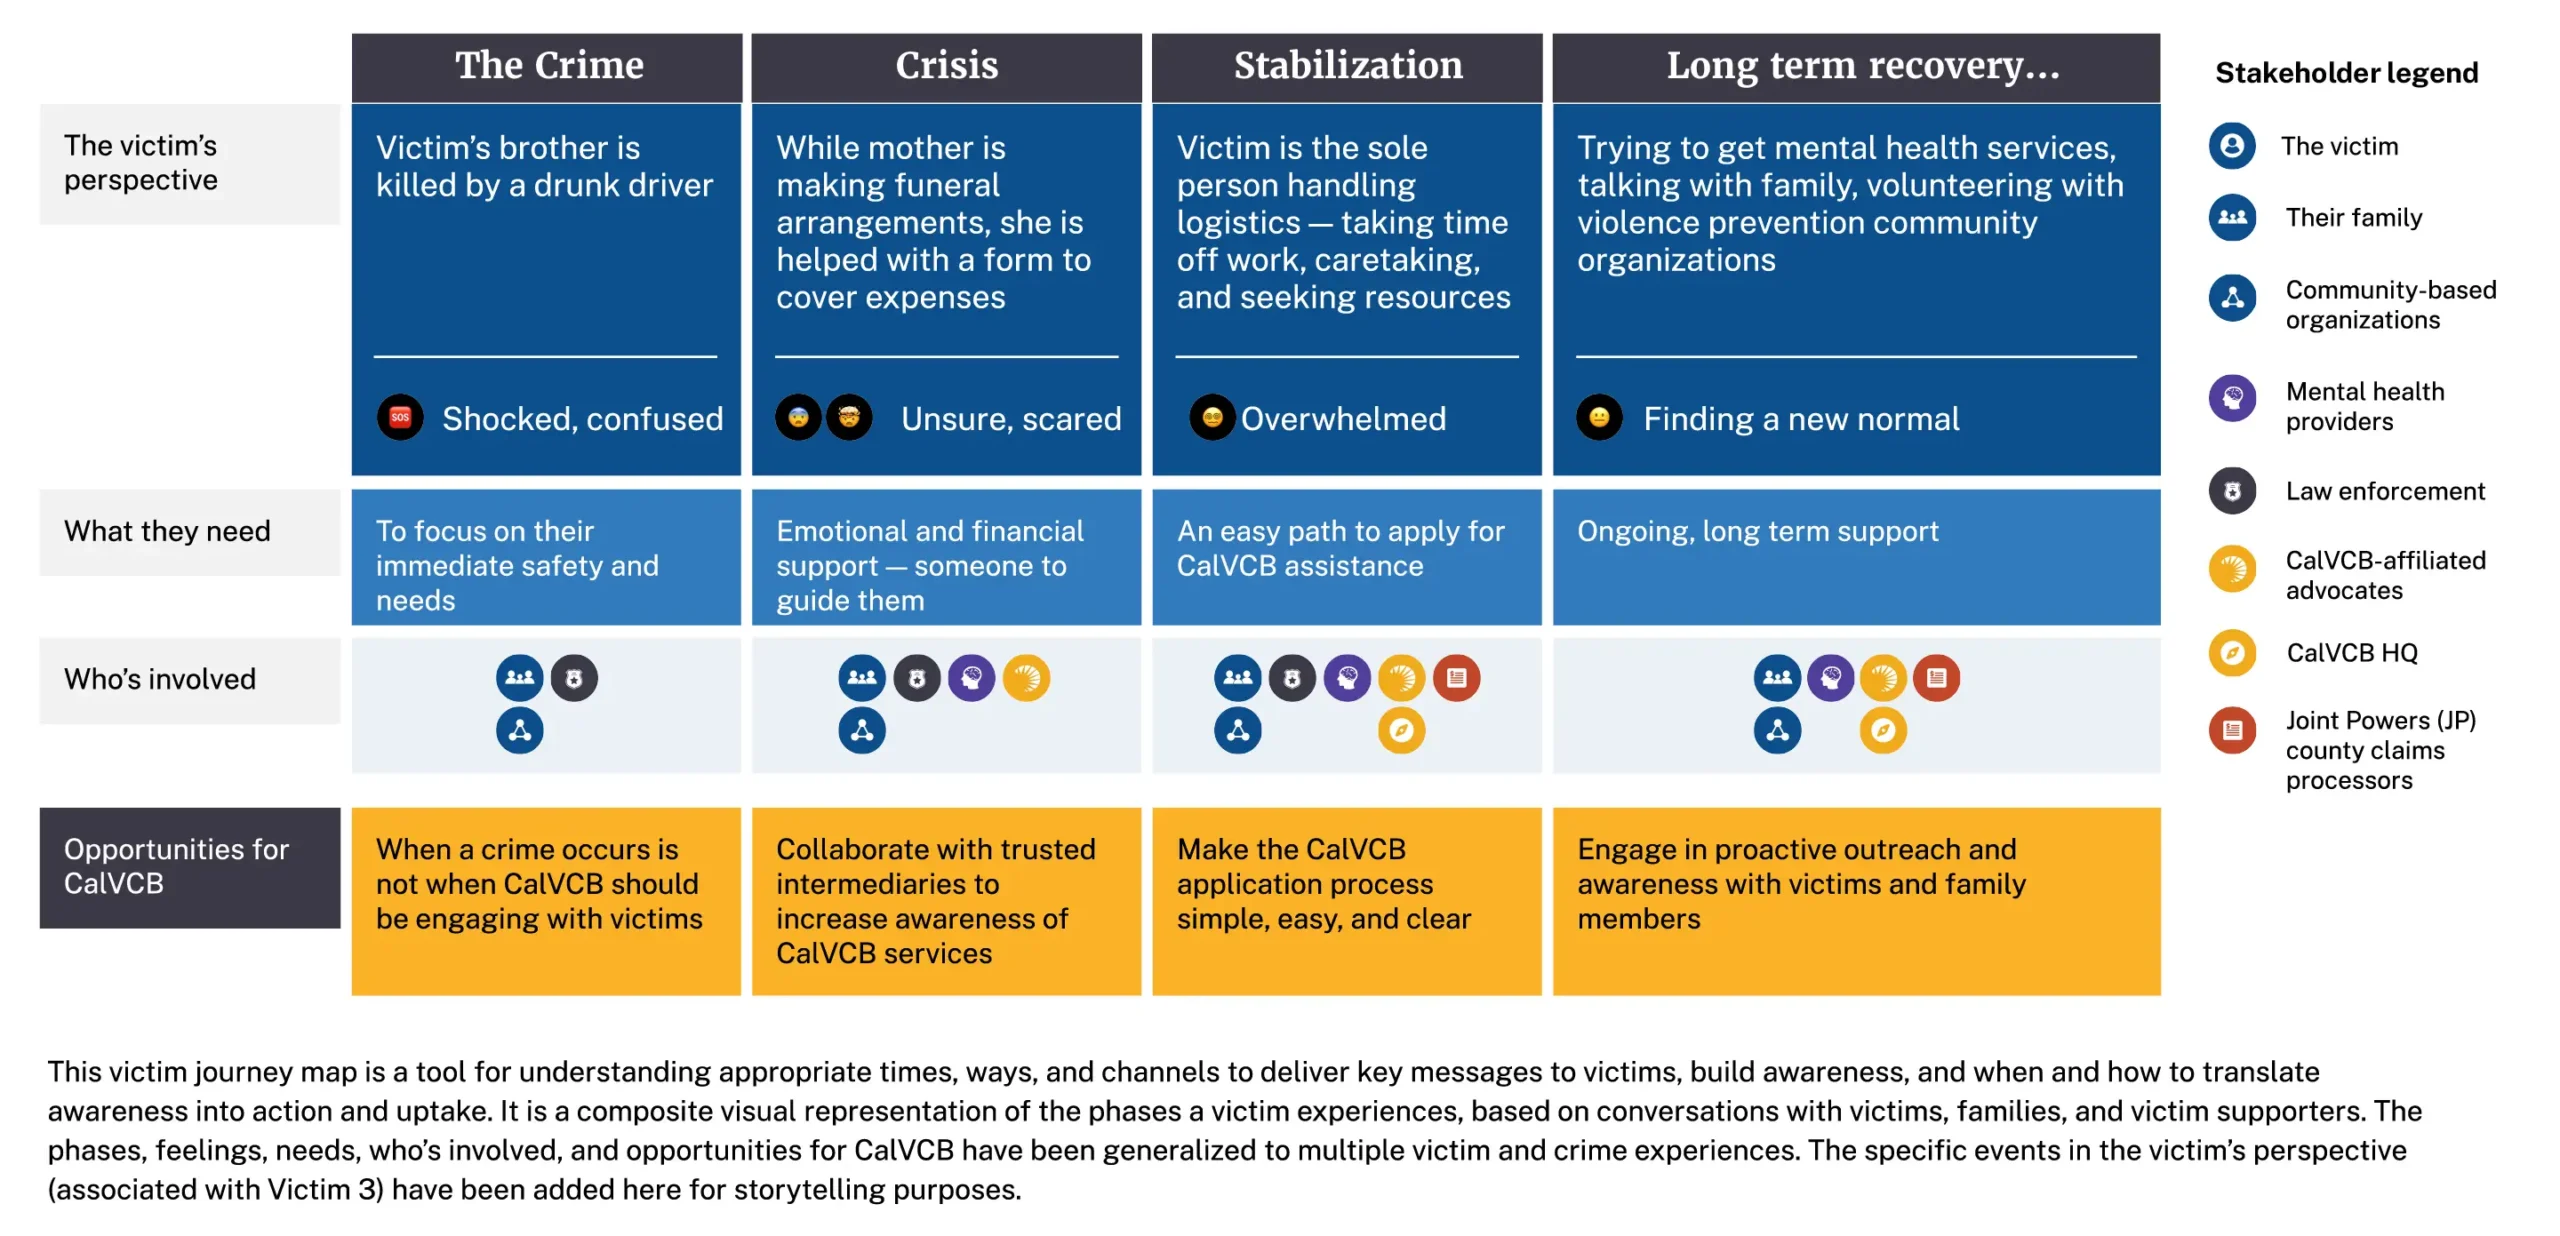
- Victim journey map: The stories we gathered were compiled to show the stages of victim recovery from the moment of a crime, navigating the immediate crisis, returning to stability, and long-term recovery.
- Stakeholder role cards: These highlight important players in a victim’s recovery and identify how to engage different audiences for messaging.
- Victim vignettes: These outline the recovery experiences of victims we spoke with in order to help connect CalVCB’s work back to those that it ultimately impacts.
Spotlight: Victim journey map

[Victims are] more likely to put it off at the very beginning when they first come in. Everything is overwhelming… Usually it’s the follow ups when they say, ‘Yeah, I do want legal or compensation.’ I’ve had clients where it’s the 5th follow up.
—Victim advocate
Insights
Our research revealed that lack of awareness is not the only reason victims do not apply for compensation. Victims face many burdens: stress, injury, loss, financial strain, and having to navigate law enforcement, healthcare, insurance, and the justice system. Given this, small barriers, like a form that is too complex, can hinder them in getting help.
Centering the victim experience is crucial to improvements
Hearing victim stories and mapping the stages of recovery helped us identify the right moments for victims to learn about CalVCB. By doing so, we learned that the benefits CalVCB provides are not obvious to those who need it. Most successful applications required the help of a victim advocate. More victims would likely apply if they could do so without help.
Enabling victim supporters leads to better outcomes
Given the importance of victim support in successful outcomes, we needed to understand who typically supports victims and how. We talked to many people in the victim support community, many of whom often work with CalVCB. From that research we created stakeholder role cards that help CalVCB understand how to more effectively partner and communicate with those who support victims.
Improving victim engagement can increase uptake
CalVCB has made many improvements in their online application forms, such as translating them into multiple languages. We found opportunities to enhance them further with visual checklists and a clearer call-to-action to apply. By making these steps more visible, victims are more likely to understand the services and benefits available to them, and not give up before getting compensation.
ODI and the Possibility Lab are continuing data analysis to better understand gaps in awareness. We hope to equip CalVCB to make informed, data-driven decisions on where and how to share messaging about their agency and services and track the impact of this work.