We found new ways to help people be aware of and take part in decisions that affect their communities.
Project scope
- Timeline: 12 months
- Team: 2 UX designers, 1 product manager, 1 user researcher, 1 engineer, 1 content designer, 1 data analyst
- Reach: 30,000 Californians living near toxic substance cleanup and storage sites
Partners
Methods
- Comparative analysis
- Content design
- Data analysis
- Desk research
- Digital performance
- Jobs-to-be-done requirements
- Journey mapping
- Mobile optimization
- Social media outreach
- Technical discovery
- User experience design
- User experience research
- Usability testing
Needs
The Department of Toxic Substances Control (DTSC) oversees toxic substance cleanup projects throughout California. They also issue permits for toxic substance storage. They asked the Office of Data and Innovation (ODI) to help increase public participation in making decisions about these sites. They were especially interested in better engaging communities who have historically not been part of decision-making.
Approach
ODI collaborated with DTSC on 3 pilot cleanup projects. We focused on 3 areas of work:
1. Redesigned Community Update
Our visual redesign made it easier to find information about cleanup sites. Plain language and content design reduced the reading level. This helped people understand the cleanup details.
2. Mobile-first design and engineering
Mobile phone ownership is high in environmental justice communities. We prioritized the mobile experience throughout our work. We created a prototype project webpage that loads fast on mobile devices. We put a QR code on the Community Update to connect readers to the webpage. This made it easier to comment.
3. Social media awareness
We promoted the cleanup projects through Facebook sponsored posts to reach more people. We tested different types of ads and campaigns to see what worked best.
Scaling
After finding what worked in the pilots, we applied these best practices to a permit project. This helped us to confirm what worked in cleanup projects also works in other types of projects.
The fourth project empowered DTSC to make the methods part of their regular process. Major milestones included:
- Mapping the internal process of gathering public comment. This found the right places to integrate with the existing workflow.
- Training Public Participation Specialists in plain language. CalAcademy, ODI’s training program, led a 90-minute training for DTSC staff. We made resources like word substitution lists for Specialists to use after the project. Select Specialists got extra one-on-one coaching so they can train their colleagues further.
- Extended visual and content design best practices across more public outreach documents. This creates a consistent experience for communities impacted by DTSC projects.
- Building the new project webpage in DTSC’s website infrastructure. Using existing systems ensured DTSC could sustain the new process without ODI.
Tools
We created a new Community Update template that puts the focus on making a comment. We reduced the number of words by 56% to help the most important information stand out. Public Participation Specialists reuse content from the template for the project webpage, avoiding extra work.
We tested our templates with the public to make sure the public comment process was easy. We also tested with DTSC staff to confirm the new templates were easy to use.
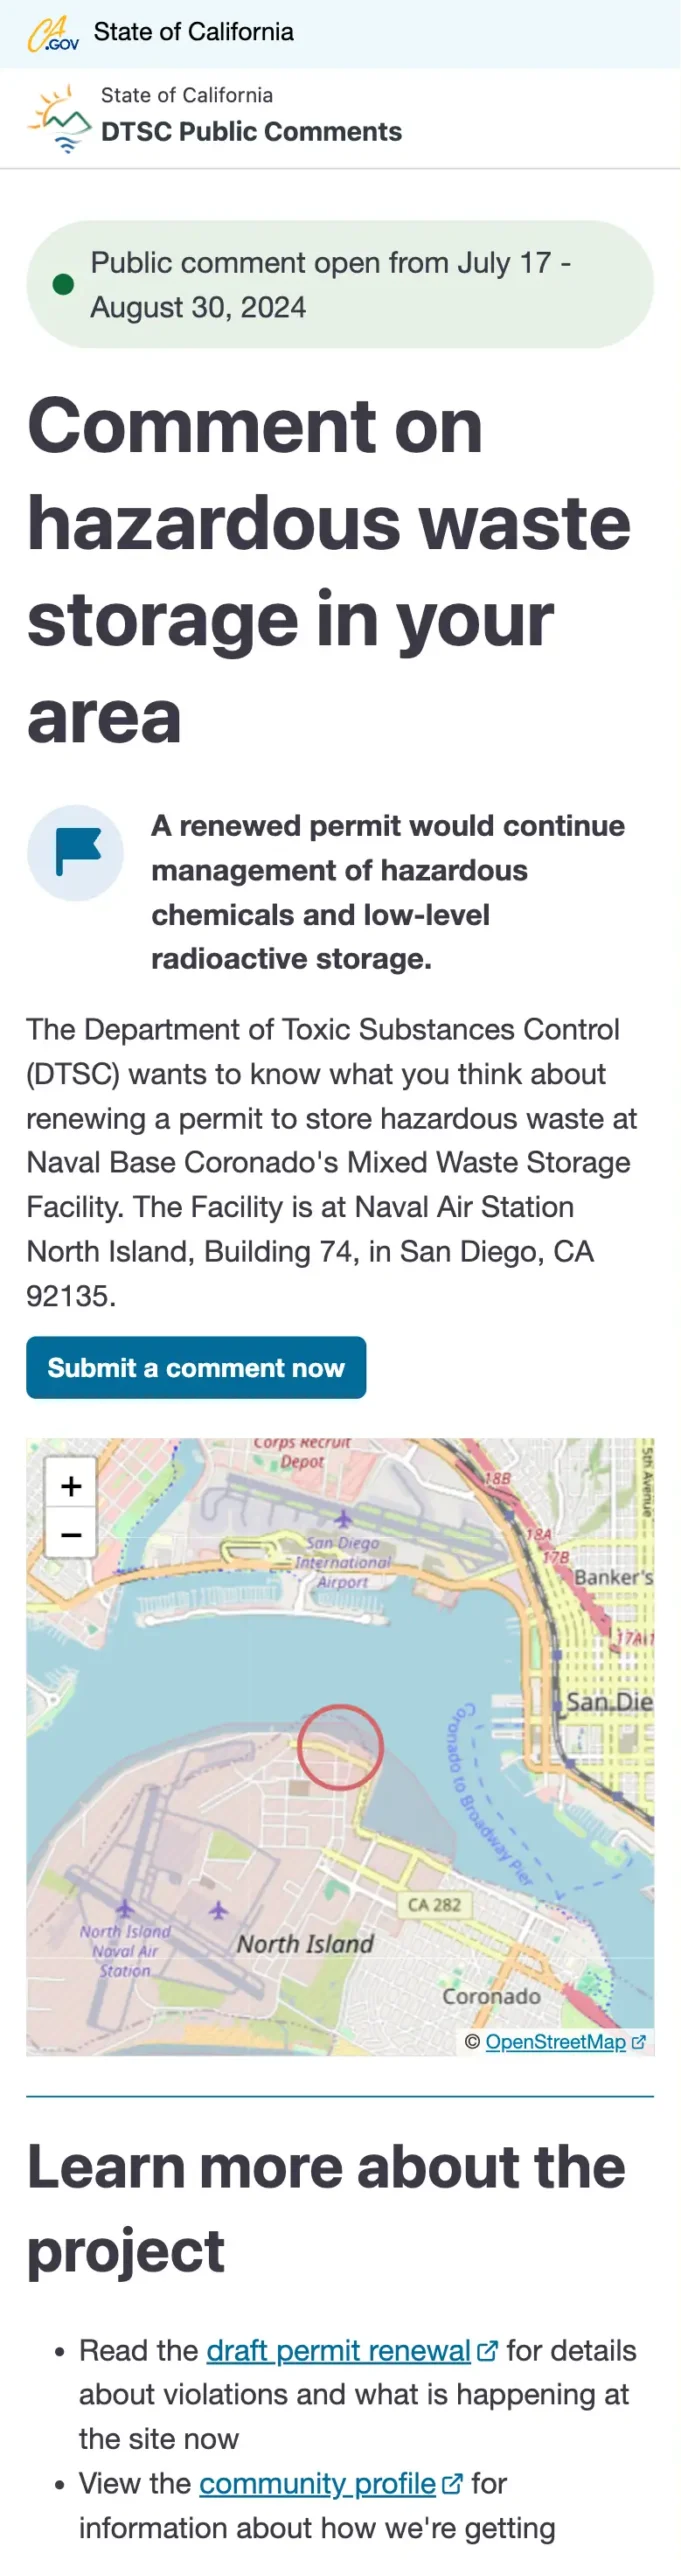
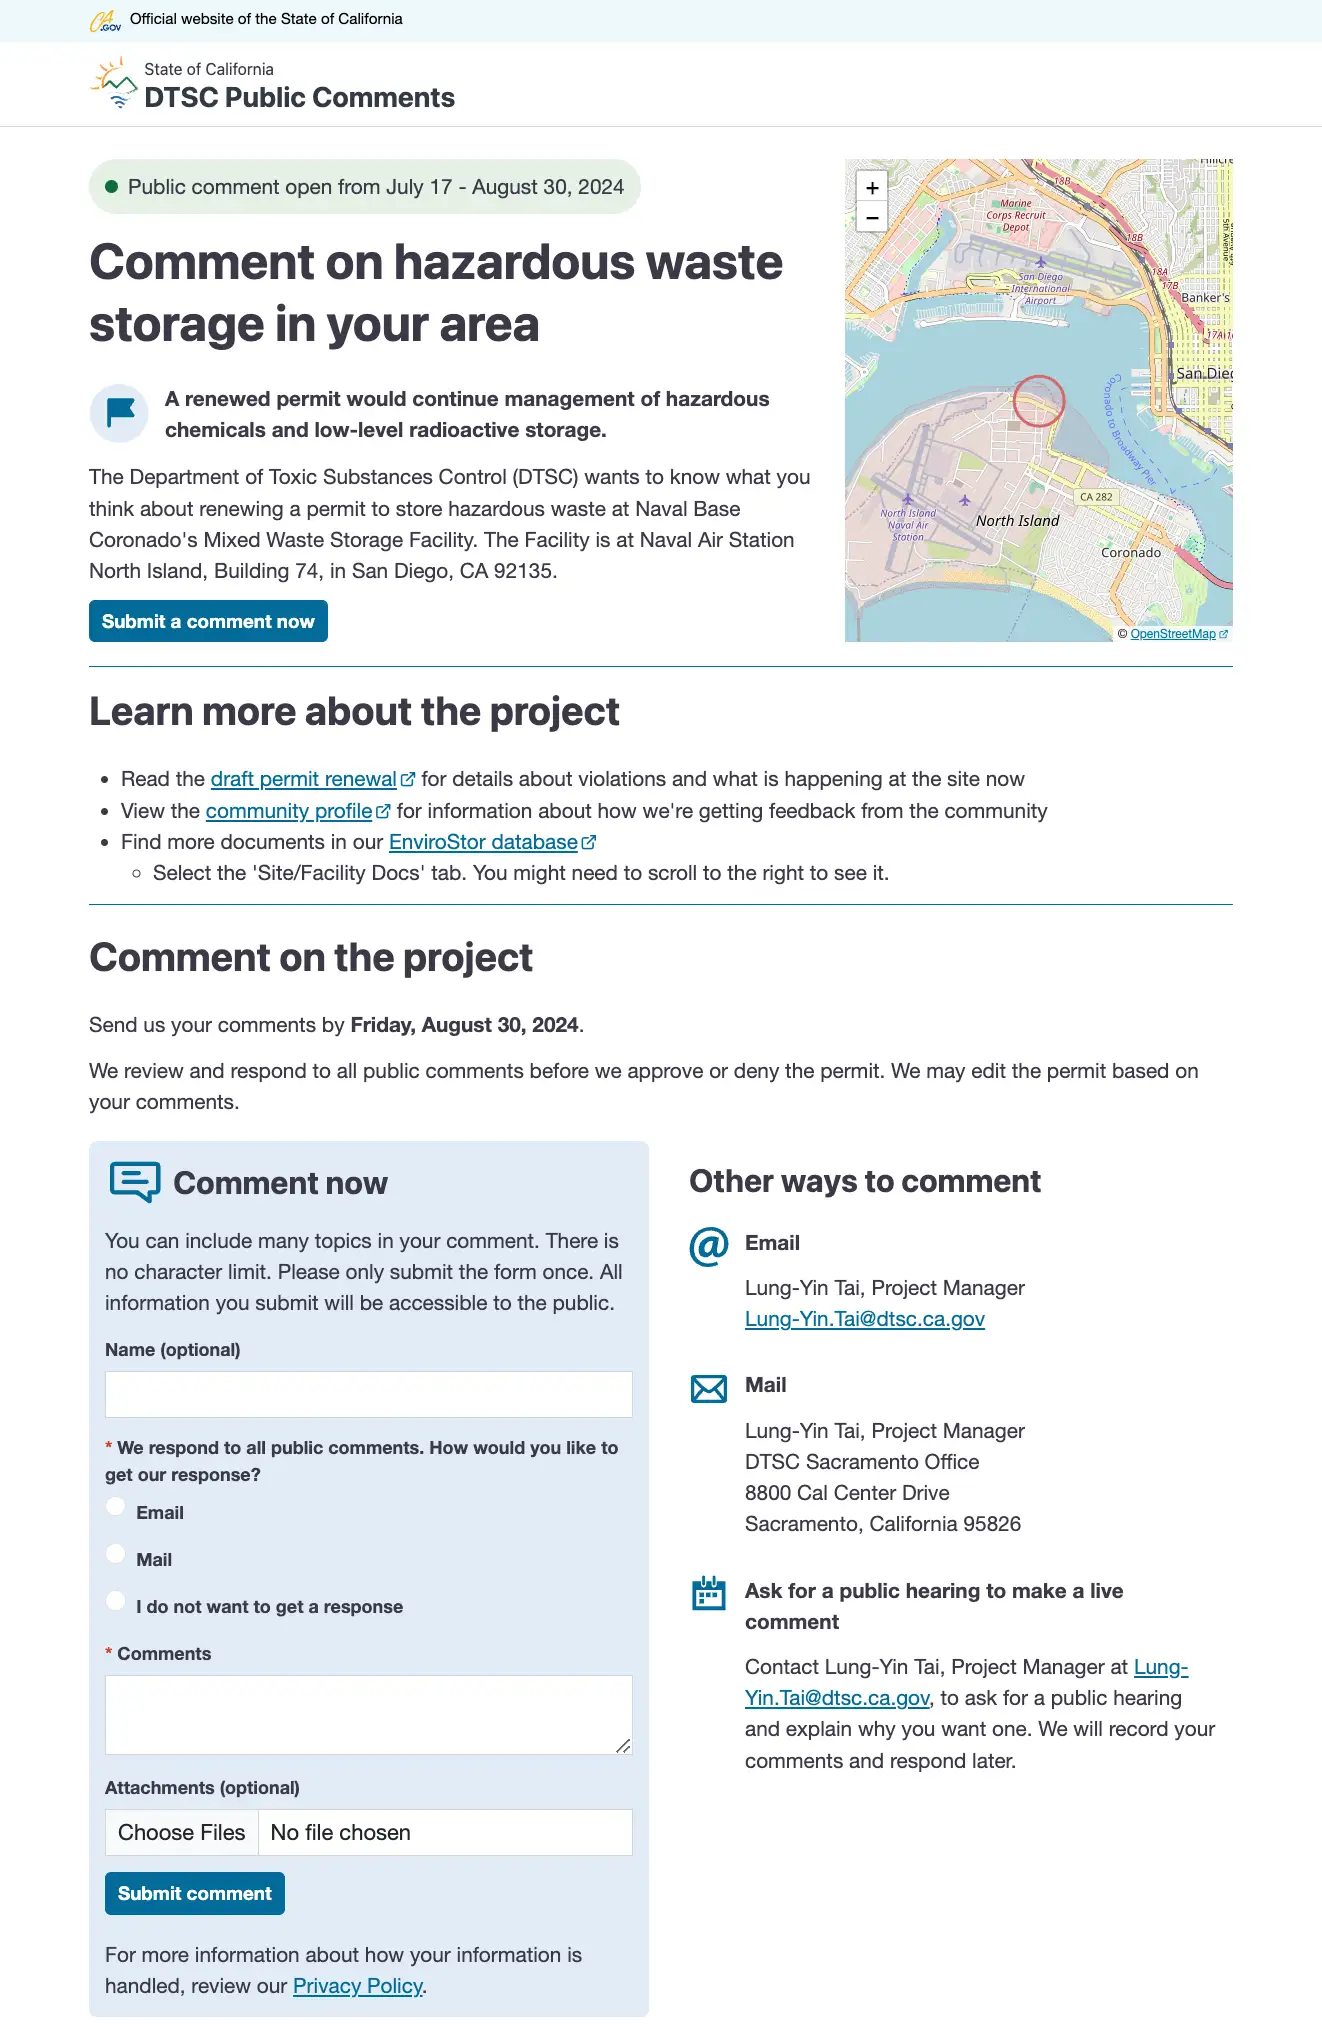
Spotlight: project webpage
Our new webpage met Californians where they are: mobile devices. The new project webpage is mobile-friendly. Its web-based form gives people a new, easier way to make a public comment.
We worked with DTSC’s IT team to build it inside their existing tools. Using technology they already knew avoided DTSC having to learn new systems. It also reduced their maintenance costs.
Mobile
Desktop
I appreciate this. I do find this form of communication clear and valuable.
—Californian after seeing the webpage
This document is very detailed…it has made me informed and it also compels me to take action and really be aware of the kinds of environmental issues that are occurring presently.
—Californian after seeing new Community Update
Insights
Our research found Californians faced 3 major barriers to commenting on projects.
Limited public comment opportunities
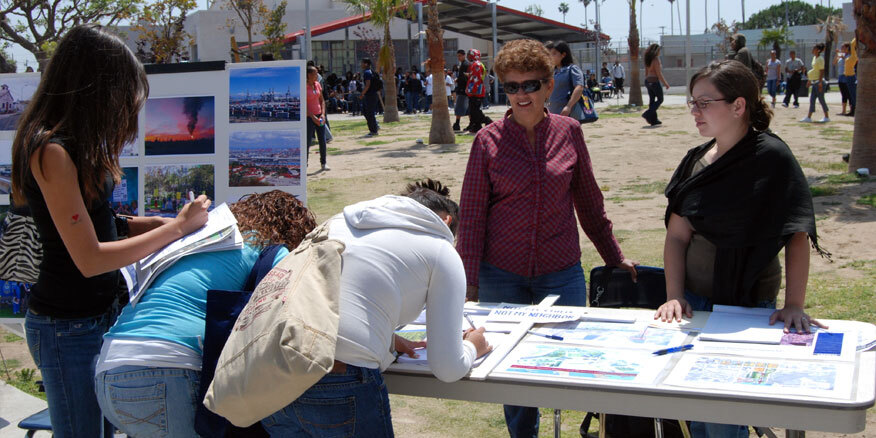
DTSC sends residents and businesses near projects a mailer called a Community Update. They must fill out a paper form to comment. Sometimes DTSC holds public meetings where people can comment. People have to put time and work into making a comment.
Hard-to-understand information
User research found Community Updates were hard for Californians to understand. They were often written at an 11th or 12th grade reading level. A busy visual design made it unclear how to be part of decision-making.
Narrowly-defined communities of interest
Community Updates are usually mailed to addresses ¼-mile around a cleanup site. This excludes people who work or attend school near a site.
Impact
We more than quadrupled the average rate of public comment with this pilot. 81% were made on a mobile device. 68% were in Spanish, even though past projects rarely got non-English comments. This proved we engaged new Californians in public comment. We reached 30,000 Californians through social media who may not have otherwise known about cleanup projects near them.
In our scaling work, we embedded innovative practices in DTSC. We trained over 50 Public Participation Specialists on plain language with even more signing up for online training through CalAcademy. This foundation will improve DTSC public-facing communications.
Our work with DTSC IT staff also resulted in significant time savings. After the pilots, DTSC estimated it would take 3 months to make a similar project webpage. By the end of the project, they estimated it would take 1-2 weeks. DTSC can now give Californians a new, digital way to comment on projects.