We are a government-to-government department. We drive statewide innovation through human-centered design practices and data-informed decisions. We partner with state departments to build the tools and processes they need to provide equitable and exceptional services to all Californians. Here’s some of the work we have done.

A data-driven approach to detecting cash benefit theft
The California Department of Social Services (CDSS) has been working on strategies to combat theft. CDSS and ODI worked together to build a model that flags theft quickly and accurately.
Designing a clear path for the state’s GenAI adoption
With a product mindset and a human-centered approach, ODI built a brand new website that guides state staff and innovators through the generative artificial intelligence (GenAI) user journey. This allows the state to quickly adopt safe and trustworthy AI to improve outcomes for Californians.

Using data to streamline housing development
The Department of Housing and Community Development (HCD) gets so much data about housing projects across California that it can cause delays due to manual review. ODI partnered with HCD to build a tool that will save staff time making reports and flag projects for review. This is a step forward for California’s goal of building more housing faster.
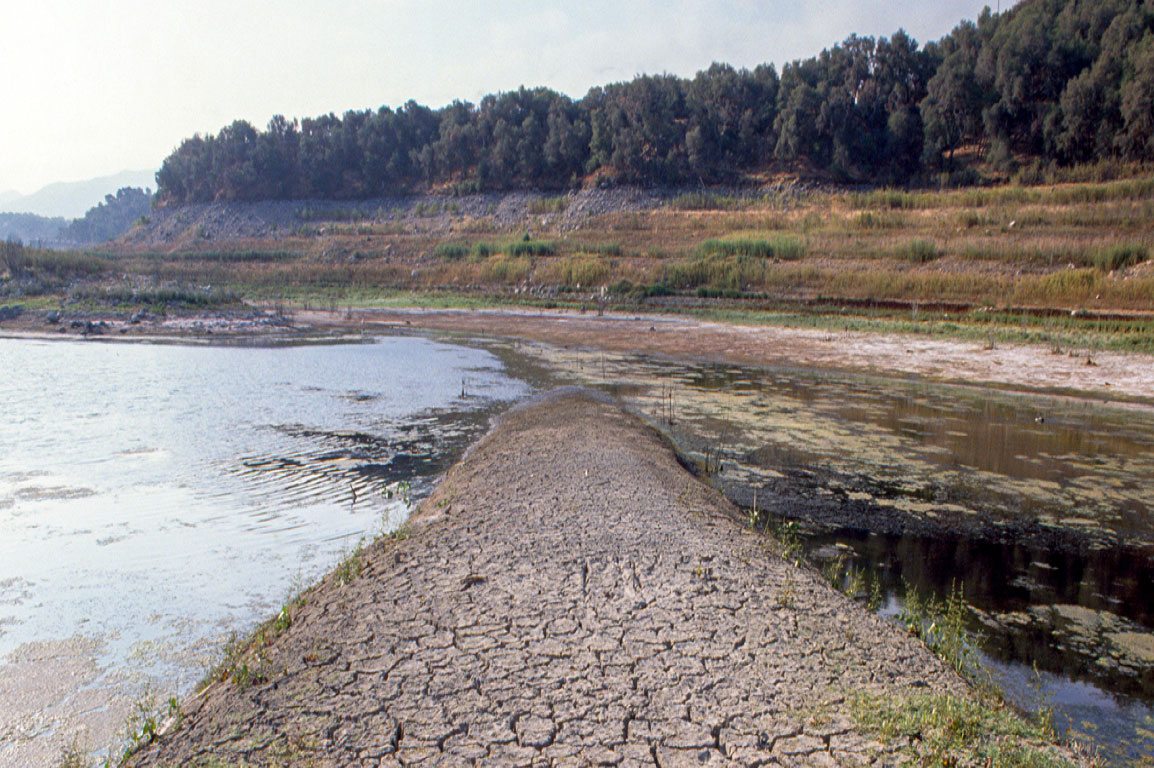
Using data to forecast drought in community water outages
ODI worked with the California Division of Drinking Water (DDW) to improve a model that forecasts which water systems will be affected by drought. This will allow communities to fix problems before they happen.
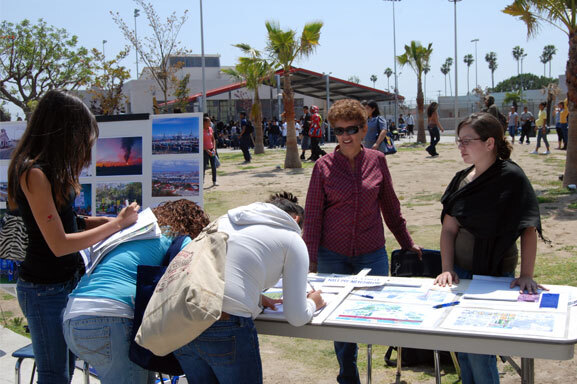
Lifting Californians’ voices in toxic substance project decisions
The Department of Toxic Substances Control (DTSC) oversees cleanup projects across the state. They also issue permits for toxic substance storage. They use comments from the public when deciding what to do at sites. Most projects get only a few comments. DTSC asked ODI to explore how to reach people who don’t usually comment. ODI ran pilots to test new ways of reaching Californians. After making a few key changes, we got 600% more comments.

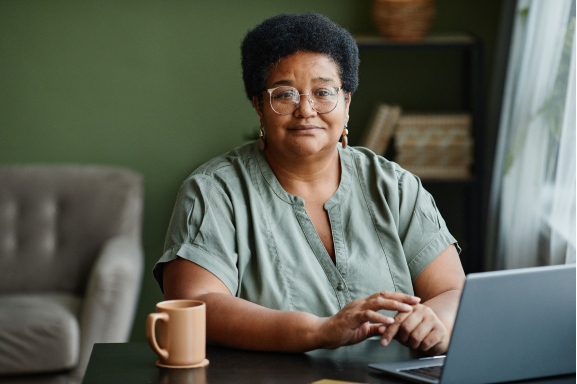
Unlocking state hiring insights
The Office of Data and Innovation (ODI) worked with the Department of Human Resources (CalHR) to make it easier to get data from a key hiring system. We built a modern data pipeline that gives staff self-service access to data. With ODI’s help, what would have been a years-long improvement process took just 4 months.

Helping more eligible families enroll in CalWORKs
CalWORKs is a major safety net program. There’s a gap between people eligible for benefits and those who get them. ODI explored why the gap exists. We interviewed applicants to learn what it’s like applying for CalWORKs. We also talked to program staff to hear what it’s like to run the program. We found pain points that stop families from getting the benefits they deserve.
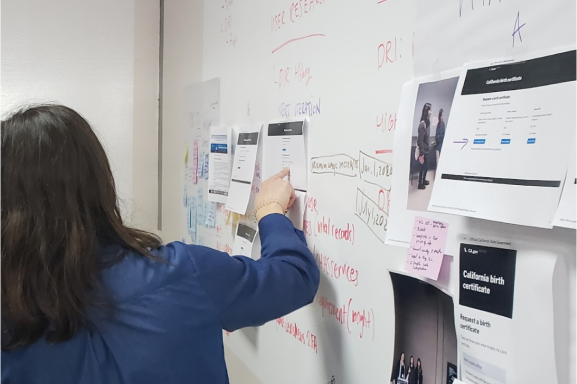
Getting compensation to more California crime victims
California Victim Compensation Board (CalVCB) noticed a puzzling trend. Despite a rise in violent crimes, fewer victims applied for compensation. CalVCB asked ODI to find out why. Their goal was to get more applications. For 6 weeks, ODI talked with victims and those who support them. We used this research and best practices in design to find ways to make it easier to apply.
California Design System
The California Design System solves common website problems. Its reusable components and patterns make state websites more consistent. Real world testing allows departments to use them with confidence. Code comes from past projects like:
- alpha.ca.gov
- covid19.ca.gov
- cannabis.ca.gov
- drought.ca.gov
Feedback from the public drives improvements. Every time we update, we test for performance and accessibility. Teams can upgrade components on their own to fit their needs. We launched the Design System in partnership with the California Department of Technology (CDT). We continue to collaborate with CDT. This will promote these best practices across the state.
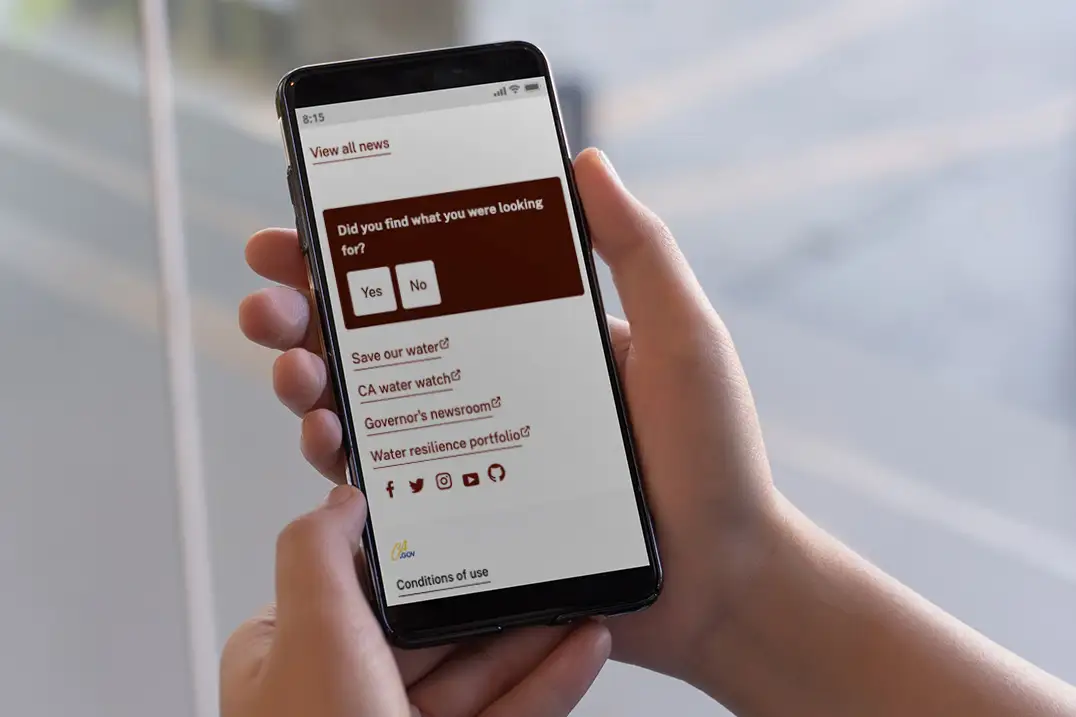
Page feedback
You can’t improve services if you don’t know what people need. The page feedback tool lets the public share their thoughts with the teams who serve them. We created it for covid19.ca.gov. It’s now on several state websites.

Accessibility and performance
At least 10% of Californians have some form of disability. We go beyond WCAG standards to design services that work better for everyone. We write at a grade 6 reading levels so it’s easier for everyone to understand our content. We make sure our services work well on most devices, not just new smartphones.
How we choose projects
Our evaluation criteria considers things like:
- Is this service critical to the lives of Californians?
- Does it impact large or underserved populations?
- How many state entities are involved in the service?
- Can our work on this service be applied to other services?
- What previous efforts can we build on?
If you’re interested in working with ODI, we’d love to hear from you.